Comparing Cloud Compute Services.
Jason Read at CloudHarmony does a great job sorting through all of the different cloud computer offerings by vendors and then compares their performance in a like-to-like benchmark. This is no small task and most reports I have read comparing cloud compute do not do a good enough job of comparing similar services when conducting their performance tests. You can obtain a copy of the full report from here which is 100+ pages long.
Below are some the test results along with my own comments as well.
| Compute Service Provider | |||
| Web Server Comparison | Small Web Server | Medium Web Server | Large Web Server |
| Amazon EC2 (Instance Types Explained) | c3.large + t2.medium | c3.xlarge | c3.2xlarge |
| DigitalOcean (Types Explained) | 4 GB / 2 Cores | 8 GB / 4 Cores | 16 GB / 8 Cores |
| Google Compute Engine (Types Explained) | n1-highcpu-2 | n1-highcpu-4 | n1-highcpu-8 |
| Microsoft Azure (Tiers Explained) | Medium (A2) | Large (A3) | Extra Large (A4) |
| Rackspace (Types Explained) | Performance 1 2GB | Performance 1 4GB | Performance 1 8GB |
| SoftLayer (Types Explained) | 2 GB / 2 Cores | 4 GB / 4 Cores | 8 GB / 8 Cores |
| Database Server Comparison | Small Database Server | Medium Database Server | Large Database Server |
| Amazon EC2 | c3.xlarge | c3.2xlarge | c3.4xlarge |
| DigitalOcean | 8 GB / 4 Cores | 16 GB / 8 Cores | 48 GB / 16 Cores |
| Google Compute Engine | n1-standard-4 | n1-standard-8 | n1-standard-16 |
| Microsoft Azure | Large (A3) | Extra Large (A4) | A9 |
| Rackspace | Performance 2 15GB | Performance 2 30GB | Performance 2 60GB |
| SoftLayer | 8 GB / 4 Cores | 16 GB / 8 Cores | 32 GB / 16 Cores |
Test Results
CPU Performance Results
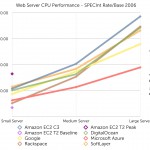
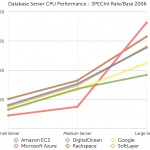
In the web server test Amazon EC2 was a little better than the rest of the competition. And in the database server test Rackspace was slightly better until the testing of large database servers where Azure’s new A9 server won out.
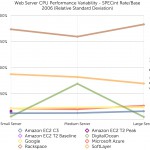
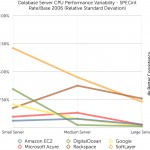
Also included in this test was CPU variability. In these multi-tenant, shared resource environments the performance over time can be a risk to a customers if that is the case this test should be taken into consideration as well as the other variable tests included in the report. For this test the lower the score the better, ideally you want the same performance over the life of the service.
In both tests Amazon had the best overall score across all server types. The changing CPU types as testing across different server types should be considered when looking at these two scores as well.
Disk Performance Testing
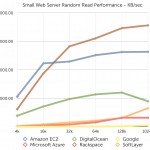
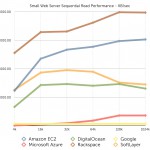
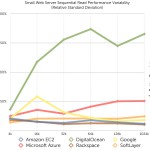
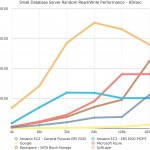
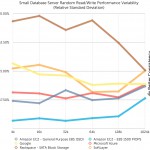
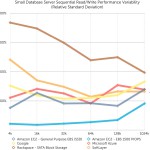
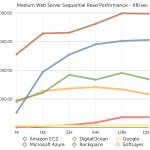
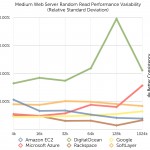
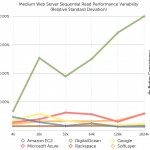
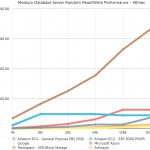
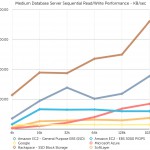
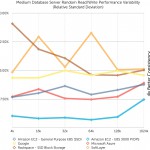
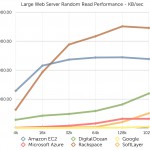
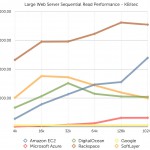
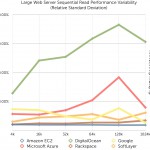
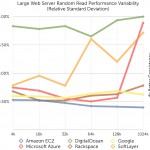
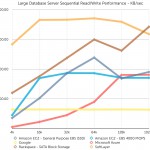
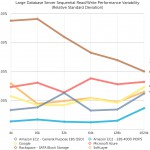
In these tests Amazon EC2 and Rackspace were consistently faster and more reliable. Since they are SSD based storage they should be faster and more consistent than the other services. DigitalOcean is also SSD based but their performance was not on par with the other SSD based services and also had the highest rate of variability. SoftLayer is not SSD based but their overall disk performance and consistency were very good. This could be from using SSD caching but no matter how they are doing it the performance speaks for itself. Microsoft Azure and Google do not offer SSD storage which is reflected in their testing.
Web Server Tests
Memory Performance
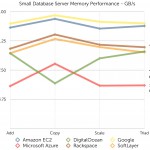
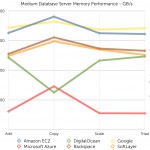
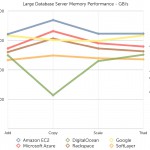
In these test they conduct them only on the database servers and because of Azure’s older hardware based on AMD CPU and MOBO they did not perform well until the large database server test where they are using the newer Intel Sandy Bridge based platform. Amazon and Google both perform well through all testing and outperformed the others. Newer hardware is always going to win in these types of tests and that is reflected here.
External and Internal Network Performance
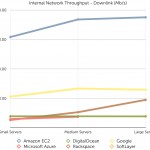
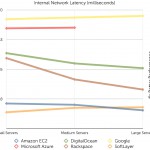
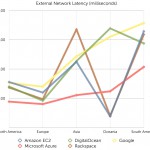
Network testing is always subjective and by testing cloud service providers networking throughput it just adds to the complexity of the configuration as some add additional ways to improve performance through different setups. Amazon, Google and Rackspace seem to provide higher throughput then Microsoft Azure, DigitalOcean and Softlayer. Also throughput by some vendors is limited depending on the size of the compute instance your purchase.
They also cover the value of each provider in their report which ultimately should be the deciding factor in choosing which cloud computing provider to use for your solution. After all there is no need to overspend on a service if you can accomplish everything you need with a cheaper solution.
You can download the full report here.


